
Views
A notebook can be viewed in multiple formats geared towards learning.
- Study: Similar to flashcard applications. Fill in blanks and self-evaluate.
- Summary: Aggregate all notes into long-form content.
- Canvas: Plot notes onto a canvas. Add connections, groups, and embed content.
- Graph: Visualize connections between notes and notebooks using backlinks.
Study View
Section titled “Study View”Study is the core learning view in Flotes, designed for focused, memory-efficient review. Use the study view to practice active recall. Notes are rendered with fill-in-the-blanks and concealed sections.
Grade yourself, track your progress, and review your notebook at a later date using spaced repetition.
Grading Options
Section titled “Grading Options”When studying, you’ll choose one of the following options as self-evaluation or grading of how well you knew the information.
- Easy: You know it effortlessly
- Good: You understand or know it with some effort
- Hard: You struggled to understand or remember
- Again: Repeat this notes fill in the blanks / concealed sections
- Archive: Remove this note from future study sessions
- Skip: Skip grading this note (no impact on your stats)
Summary View
Section titled “Summary View”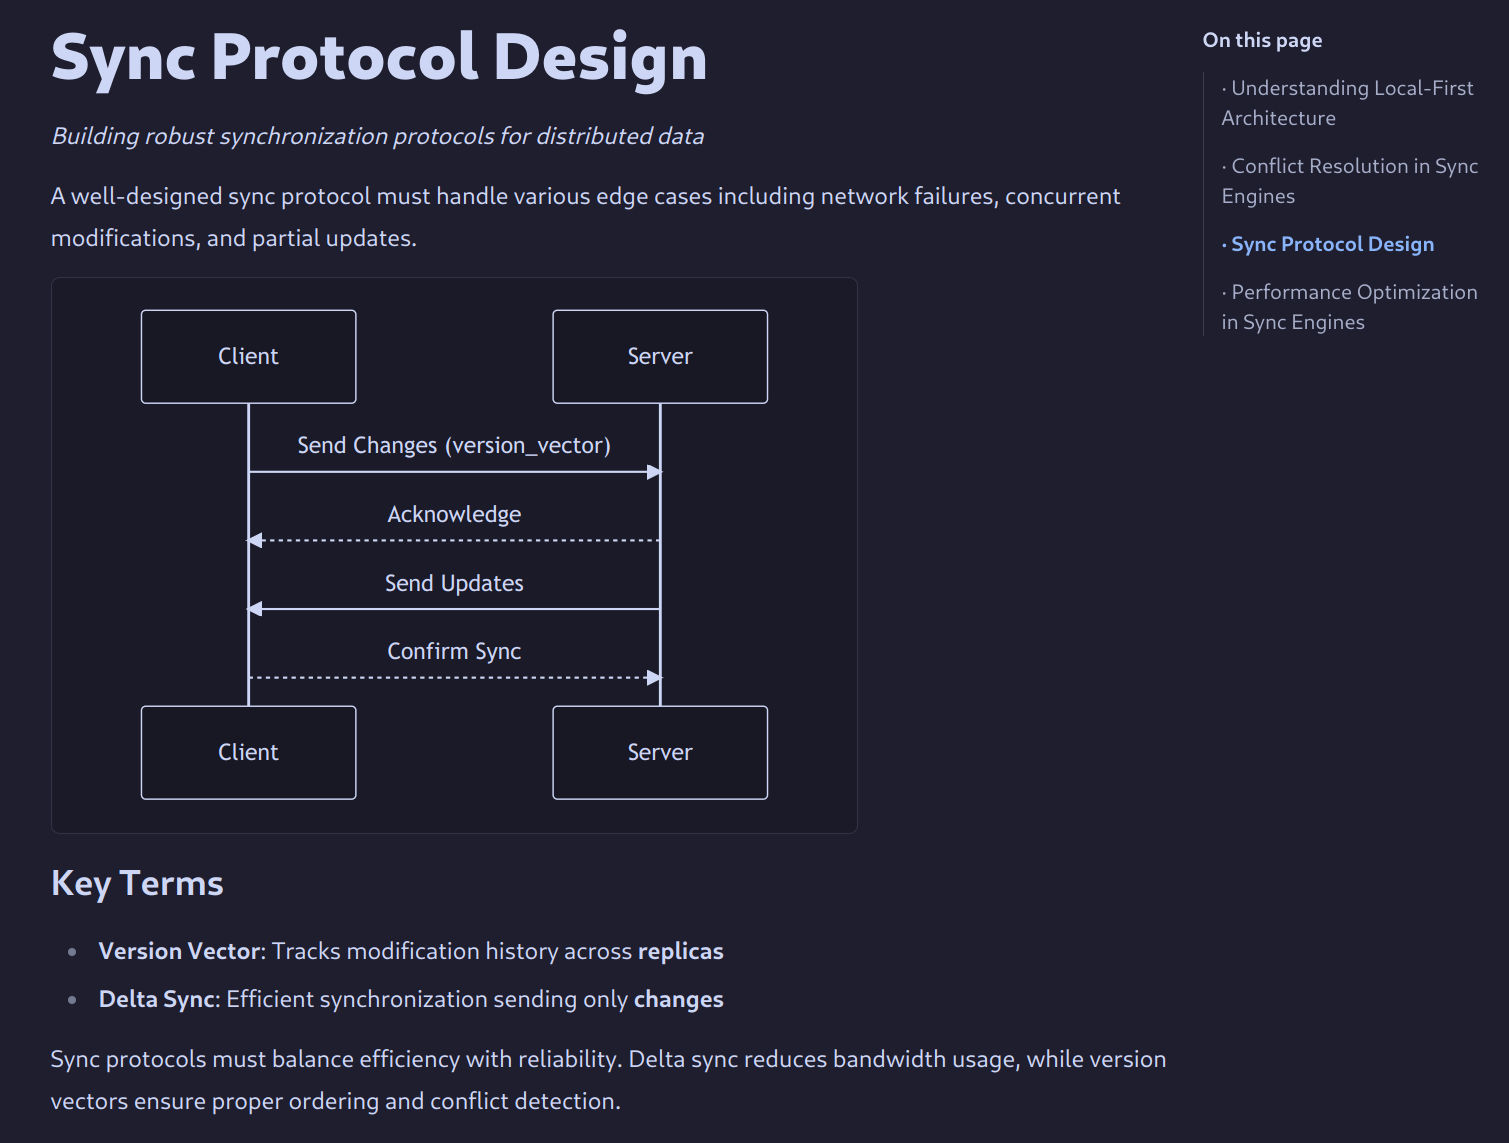
The Study View in Flotes encourages you to break down information into small, focused chunks — great for learning, but sometimes limiting when you want to see the full picture.
The Summary View offsets this by combining all notes in a notebook into a single, long-form page. This provides a complete, readable overview of your material — useful for reviewing the full context of a topic.
Canvas View
Section titled “Canvas View”
Notes stored as files—like in Markdown or most editors—are typically viewed in a linear fashion. While effective for writing and reading, this structure can limit how ideas are organized or connected across multiple notes.
The canvas view offsets this limitation by allowing notes to be placed visually on an infinite canvas. You can group related concepts, draw links between notes, and arrange them spatially to reflect your thinking.
Graph View
Section titled “Graph View”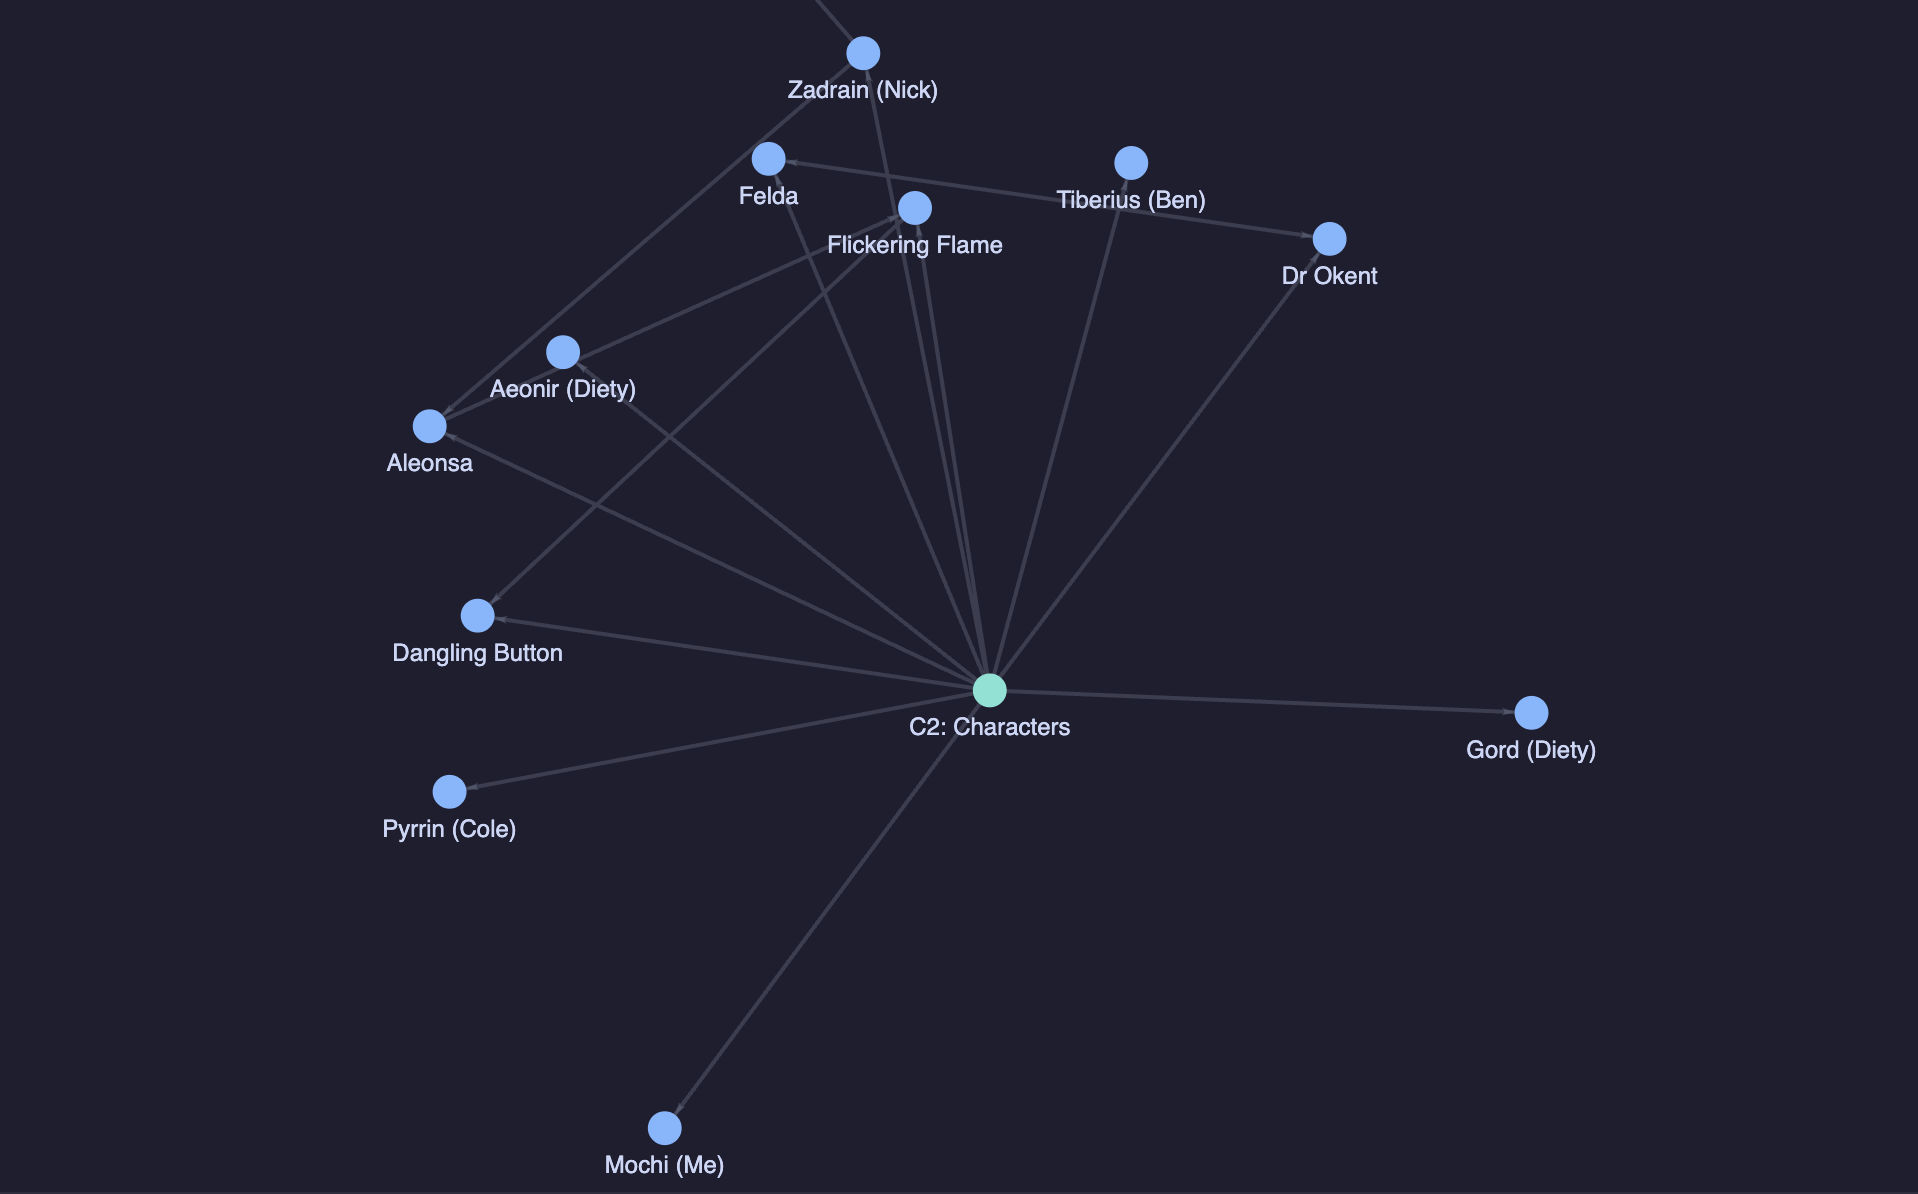
Flotes includes a graph view similar to tools like Obsidian, providing a visual representation of how your notes and notebooks connect through backlinks.
Adding backlinks to notes and notebooks automatically creates nodes in the graph view. This creates an interactive network that helps you understand the relationships and structure within your knowledge base.
- Notebook nodes (displayed in green) are clickable and will navigate to that notebook’s graph view
- Note nodes (displayed in blue) are clickable and will navigate to edit/read that note
The graph view enhances navigation and makes it easier to discover connections between different parts of your notes, turning your notebook into an interconnected web of knowledge.